
Performance Dashboard and Interactive Reports
Healthy churches grow, and as they grow, it’s becomes harder for leaders and staff to keep up with what’s happening in the church. Key church analytics on giving, attendance and serving are critical to monitoring church health.
Seeing results quickly and easily means that church leaders can make decisions efficiently. It’s also important to see contributing factors and trend changes in order to dig into details so you can take immediate action to correct or enhance the results of your ministry.
In a 2014 survey done at Strata + Hadoop World conference, 84% of business leaders said they need to blend four or more data sources/reports and nearly half reported that they have to blend 8 to 15 sources! Challenges like this lead to delays in decision-making and inhibit your ability to take action.
That’s why we’re working on two solutions that will present key performance indicators to church leaders in areas that truly indicate ministry impact like giving, attendance, baptisms and more. This functionality will be released this year to all premier users.
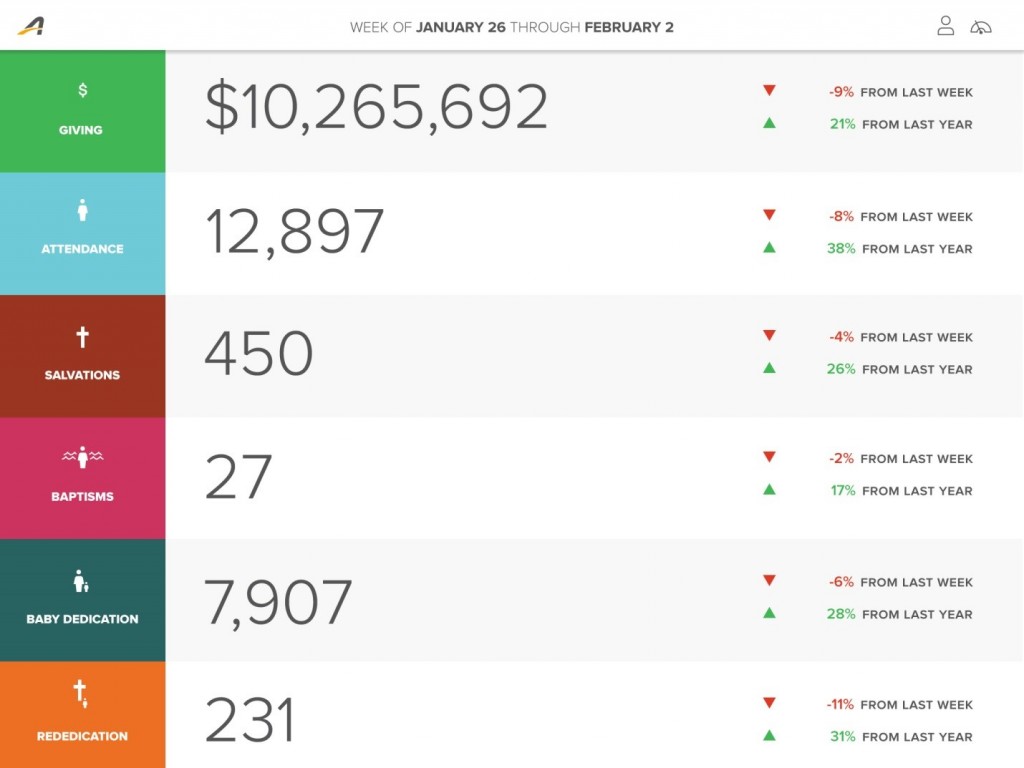
Dashboard
Senior Pastors are often focused on teaching and casting vision for the church. They frequently rely on others to provide key metrics on performance. In order to do this, church admin must pull various core reports and build a dashboard for the Senior Pastor. Often times, these reports may not dive as deep as the Senior Pastor would like. It can also be a challenge to integrate key ministry performance data together in order to get a holistic view of what’s happening. This can delay decisions by weeks or even months while data is being collected and massaged into usable reports.
The NEW Dashboard will present key metrics in a responsive web format that’s easy to understand and requires no training or report expertise. Data will be complemented with trend charts and contain period comparison views by week, month, quarter or year to assist senior leaders in understanding the broad trends within the key metrics.
Have your own unique key metrics? Not a problem. The Dashboard is customizable based on the information you want to store within your database.
Having the key performance data of your church at your fingertips means that you’ll have the ability to quickly learn and act on the challenges and opportunities that face your ministry.
Interactive Reporting
Today, churches primarily rely on Fellowship One’s complex “Core Reports”. These reports are widely used by Fellowship One experts to answer a variety of questions through a series of filters. Unfortunately, their complexity makes them unsuitable to the typical senior pastor and even many executive pastors. That’s why we’re inventing a new reporting solution that will give church leaders an easier way to gain insight.
Coming this year, we will activate Interactive Reports focusing on three key areas:
- Giving
- Attendance
- People
This interactive reporting environment will allow users to start with data and then drill into the details that warrant a closer look or apply filters to segment data into sub-groups, like payment type, activities, or age.
Here’s a brief explanation of more features within Interactive Reporting:
- Rather than starting with a form, you start with data that can be easily modified or filtered.
- Modify your own filters or bypass filter selection on report entry
- Modify row and column grouping to fit your reporting needs
- Save new reports by name after modifying from defaults
- Instantly make highly formatted, print-ready reports
- Export precisely what is being viewed on the screen to XLS, XLST, CSV or PDF file
- Included “Filters Used in Report” section on each view so that the data is easier to interpret and modify as needed
- Reports will automatically generate, reducing your wait time.
With the NEW Interactive Reporting and legacy Core Reports, it has never been easier to get the meaningful data you need in order to make decisions that create a positive impact in your communities.
What’s Next?
These new enhancements are just the beginning of our reporting platform upgrades. While you’ll be thrilled with the initial additions to our ChMS reporting, you’ll be continuously pleased with the enhancements coming down the pipeline.
Our goal is for you to be able to mine your most important and relevant ministry data in minutes. One of the most important things we can do is help you measure your efforts and make decisions that have a positive impact on your ministry and community.